Indonesia Land Use Change Detection: Multi-Sensor Satellite Remote Sensing & Spatial Econometrics
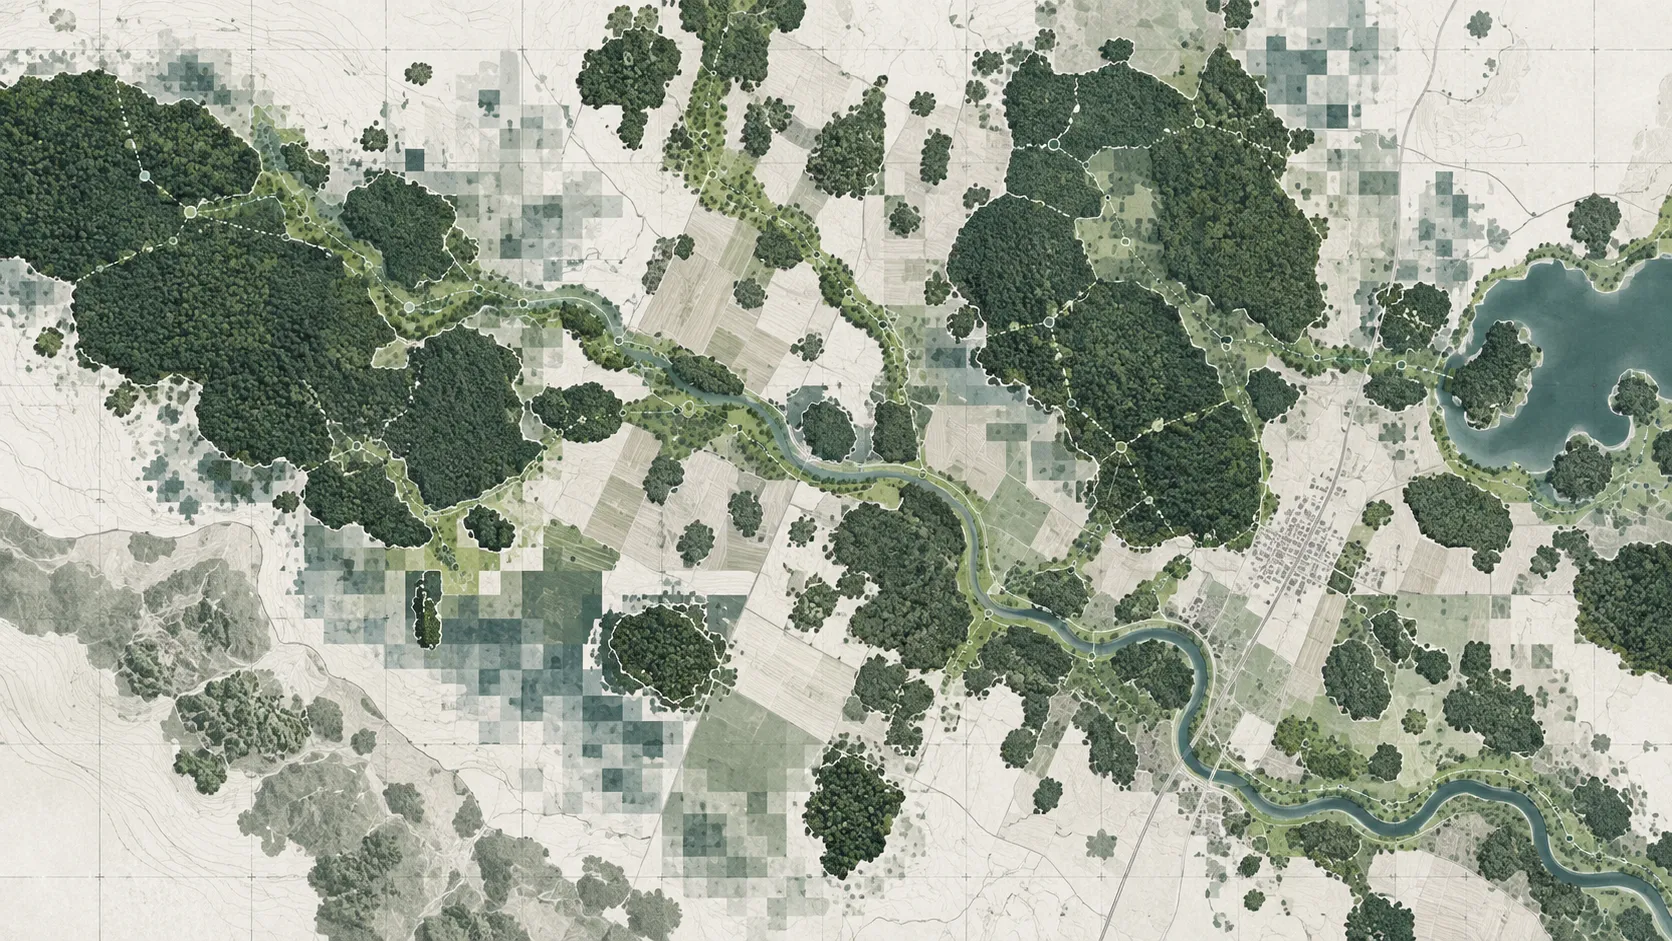
A large-scale spatiotemporal panel study analyzing land use and land cover (LULC) dynamics across 518 Indonesian regencies from 2000 to 2023, integrating Google Earth Engine, MapBiomas LULC, MODIS NDVI, and spatial regression models to quantify deforestation and agricultural expansion drivers.

THE QUESTION
What are the quantitative spatiotemporal relationships between agricultural commodity expansion, infrastructure development, and primary forest loss across 518 Indonesian regencies over a 24-year observational horizon?
BACKGROUND
Tropical deforestation in Indonesia represents a critical nexus between terrestrial carbon emissions, biodiversity loss, and economic development. While satellite-derived monitoring platforms like GFW and MapBiomas provide high-resolution canopy loss alerts, local-scale policy interventions require rigorous spatial econometric modeling that accounts for spatial autocorrelation and cross-boundary spillover effects. This project ingested 24 years of multi-sensor satellite imagery across 518 regencies and cities (kabupaten/kota) to model commodity-driven land conversion drivers.
APPROACH OVERVIEW
SATELLITE DATA INGESTION & HARMONIZATION
Cloud-native processing on Google Earth Engine combining Landsat 7/8/9 surface reflectance, MapBiomas Indonesia Collection 2, MODIS Terra/Aqua 16-day NDVI composites, and CHIRPS precipitation grids.
SPATIAL AGGREGATION & FEATURE EXTRACTION
Zonal extraction across 518 administrative district boundaries (BPS 2023 shapefiles), deriving yearly forest loss area, palm oil conversion velocity, urban fringe expansion, and nightlight radiance.
SPATIAL WEIGHTS & AUTOCORRELATION TESTING
Construction of spatial adjacency matrices (queen contiguity and k-nearest neighbors) followed by Global and Local Moran's I statistics to detect spatial clustering of deforestation hotspots.
SPATIAL ECONOMETRIC PANEL REGRESSION
Estimation of Spatial Autoregressive (SAR) and Spatial Error Models (SEM) with district fixed effects to isolate direct versus indirect spillover impacts of infrastructure and agricultural concessions.
POLICY SIMULATION & MONITORING DASHBOARD
Synthesis of regression coefficients into concession risk indices and interactive spatial vector layers delineating high-risk transition corridors in Sumatra and Kalimantan.
METHODS
- •Earth Observation Pipelines: Multi-temporal cloud masking and mosaic compilation in Google Earth Engine utilizing MapBiomas Indonesia LULC classifications (30 m spatial resolution) and MODIS MOD13Q1 NDVI time series from 2000 through 2023.
- •Administrative Boundary Zonal Analysis: Vectorization and geo-computation across 518 regencies and cities in Indonesia using GeoPandas, Shapely, and Rasterio, aggregating yearly net forest conversion, grassland encroachment, and urban settlement extent.
- •Spatial Autocorrelation Profiling: Calculation of univariate and bivariate Local Indicators of Spatial Association (LISA) in PySAL to demarcate statistically significant High-High deforestation clusters.
- •Econometric Panel Modeling: Fixed-effects panel regression incorporating Spatial Durbin Model (SDM) specifications to disentangle direct localized deforestation drivers from spatial lag spillovers induced by adjacent district logging activities.
- •Ancillary Environmental Covariates: Integration of VIIRS Nighttime Lights (economic activity proxy), CHIRPS pentad precipitation anomalies, and digital elevation model (SRTM 30 m) slope gradients.
KEY DATA SNAPSHOT
RESULTS
Spatial econometric regression demonstrated that forest loss in Indonesian regencies is significantly driven not only by internal agricultural expansion but also by spatial spillover from neighboring districts (spatial autoregressive parameter rho = 0.342, p < 0.001). Road infrastructure and concession allocations in one district exerted a measurable deforestation pressure on adjacent administrative units within an 85 km radius.
DISCUSSION
Cross-district spatial spillover accounts for over one-third of observed secondary forest clearance, indicating that district-level moratoriums without transboundary coordination trigger leakage into bordering jurisdictions.
Local Moran's I clustering revealed persistent High-High deforestation corridors concentrated along low-elevation peatland margins in Riau, Central Kalimantan, and Southern Sumatra.
Commodity price index shocks for crude palm oil (CPO) showed a 14-month lagged coefficient peak on conversion rates, offering a predictive operational window for regional forestry oversight agencies.
LIMITATIONS
- •Cloud cover persistence across equatorial regions required annual composite aggregation, which precludes sub-monthly seasonal deforestation event attribution.
- •Administrative boundary splits (pemekaran daerah) across the 24-year timeline required spatial back-casting and harmonization to maintain balanced panel geometry.
IMPACT & APPLICATION
DATA & REPRODUCIBILITY
Analytical code and specific target coordinates are currently held under institutional review and confidential protocol.
REFERENCES
- mapbiomas2023MapBiomas Indonesia (2023). Collection 2.0 of Indonesian Land Cover and Land Use Change. MapBiomas Project.
- anselin1988Anselin, L. (1988). Spatial Econometrics: Methods and Models. Kluwer Academic Publishers, Dordrecht.